2 Elements of the monitoring system for environmental quality
Table 2.1 Indicators, reference values and action thresholds
Indicator | Reference value | Action threshold |
|---|---|---|
Ocean climate | ||
Extent of ice cover in the Barents Sea | Mean values 1979–2008 | |
Temperature, salinity and nutrients along fixed transects | Mean for whole measurement period | |
Transport of Atlantic water into the Barents Sea | Mean for whole measurement period | |
Marginal ice zone | ||
Phytoplankton biomass in the marginal ice zone (indicator under development) | Mean over the last 10 years | |
Phytoplankton | ||
Timing of spring bloom (indicator under development) | ||
Phytoplankton biomass expressed as quantity of chlorophyll a | Mean over the last 10 years | |
Species composition1 | Historical data | |
Zooplankton | ||
Zooplankton biomass | Mean distribution over the last 10 years | |
Species composition1 | Historical data | |
Fish stocks that are not harvested | ||
Biomass and distribution of juvenile herring2 | Historical data | |
Biomass and distribution of blue whiting | Historical data | |
Fish stocks that are harvested | ||
Spawning stock of cod | Precautionary reference point | Estimated spawning stock is below the precautionary reference point |
Spawning stock of capelin | Precautionary reference point | Estimated spawning stock is below the precautionary reference point |
Spawning stock of Greenland halibut | Precautionary reference point (not known) | Estimated spawning stock is below the precautionary reference point |
Spawning stocks of fish stocks that are being rebuilt to sustainable levels (golden and beaked redfish) (indicator under development) | Precautionary reference point3 | Estimated spawning stock is below the precautionary reference point |
Benthic organisms | ||
Species composition and quantity of benthic organisms and fish taken during research bottom trawling | Under development | Under development |
Distribution of coral reefs, soft corals and sponge communities4 (indicator under development) | Distribution and state of known sites | Significant rise in the extent of damage or reduction in distribution in areas that are monitored |
Occurrence of red king crab | Distribution of red king crab | Spread of red king crab to new areas |
Seabirds and marine mammals | ||
Spatial distribution of seabird communities | Average population numbers, last 10 years, and historical data | |
Population trend for common guillemot | Average population numbers, last 10 years, and historical data | Viable population level when population is below this: or a population decrease of 20 % or more in five years, or failed breeding five years in a row |
Population trend for Atlantic puffin | Average population numbers, last 10 years, and historical data | Viable population level when population is below this: or a population decrease of 20 % or more in five years, or failed breeding five years in a row |
Population trend for Brünnich’s guillemot | Average population numbers, last 10 years, and historical data | Viable population level when population is below this: or a population decrease of 20 % or more in five years, or failed breeding five years in a row |
Population trend for black-legged kittiwake | Average population numbers, last 10 years, and historical data | Viable population level when population is below this: or a population decrease of 20 % or more in five years, or failed breeding five years in a row |
Breeding success and adult survival in selected seabird species | Breeding success at a normal level for the species, sufficient to maintain a normal level of adult survival. Adult survival at a normal level for the species, sufficient to maintain a normal level of breeding success | Average breeding success over a three-year period insufficient to counteract natural adult mortality. Average decline in adult survival more than 20 % over two years. |
Spatial distribution of marine mammals | Average population numbers, last 10 years, and historical data | |
Bycatch of common porpoise | Average for the first three years of comparable monitoring | Rise in bycatch compared with the reference value |
Alien species | ||
Records of alien species | Historical data | Alien species recorded during monitoring |
Vulnerable and endangered species | ||
Red-listed species5 | Viable population level and historical data on population levels | Population of selected species is below the level considered to be viable |
Pollutants (see Figure 2.1) | ||
Pollutants in fish, polar bears, seabirds, marine mammals and benthic animals | Natural background level | Rise in pollutant concentrations continuing for specified number of years, or sudden large rise from one sample to the next in an area, to above natural background level |
Pollutants in sediments | Natural background level | Rise in pollutant concentrations continuing for specified number of years, or sudden large rise from one sample to the next in an area, to above natural background level |
Inputs via rivers | Natural background level | Rise in pollutant concentrations continuing for specified number of years, or sudden large rise from one sample to the next in an area, to above natural background level |
Atmospheric inputs | Natural background level | Rise in pollutant concentrations continuing for specified number of years, or sudden large rise from one sample to the next in an area, to above natural background level |
Levels of radioactivity in sediments, seaweed and fauna along the coast | Natural background level | Rise in radioactivity level continuing for specified number of years, or sudden large rise from one sample to the next in an area, to above natural background level |
Beached litter | No litter | Unacceptable amounts of litter on shoreline |
1 Samples for determination of species composition are taken along the Fugleøya–Bjørnøya transect.
2 Juvenile herring mature in the Barents Sea, but are fished in other waters.
3 Precautionary reference points must be determined for species for which they are not available at present.
4 This indicator cannot be used until surveys of coral reefs and sponge communities have been made.
5 For a list of species considered to be vulnerable or endangered in the area, see Box 3.6 on species on the 2010 Norwegian Red List
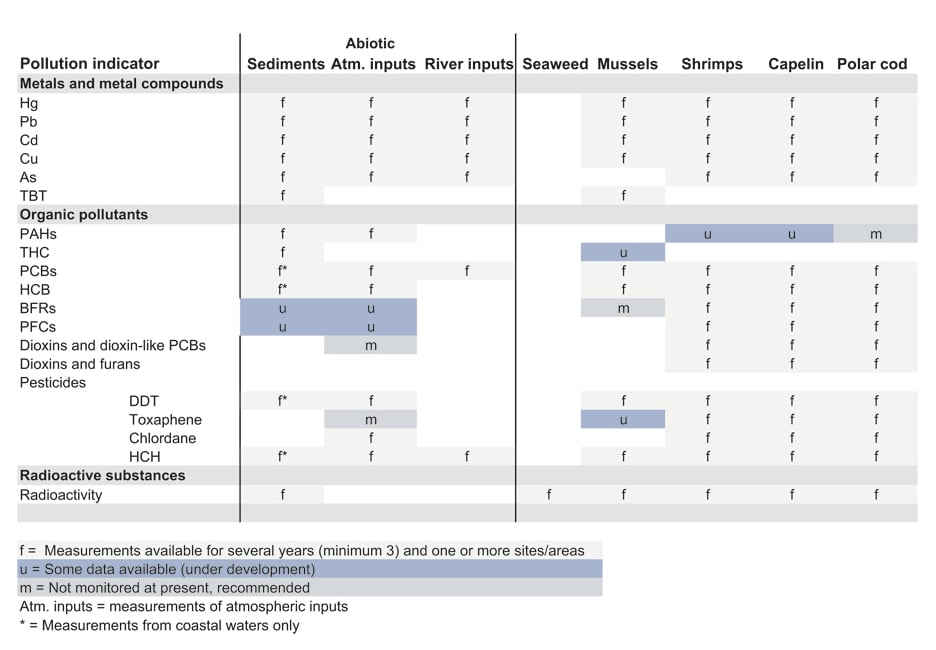
Figure 2.1 Current and proposed pollution indicators, showing current and recommended sample types